

Home>
Resources>
Learning>
Articles>
PDGFRA and PDGFRB Cell Models for Drug Discovery and Target Validation
PDGFRA and PDGFRB Cell Models for Drug Discovery and Target Validation
Platelet-derived growth factor receptor alpha (PDGFRA) and platelet-derived growth factor receptor beta (PDGFRB) are well-established targets in oncology and fibrosis drug development. The success of imatinib (Gleevec) in gastrointestinal stromal tumor (GIST) and the activity of avapritinib against the PDGFRA D842V mutation both reflect the therapeutic relevance of these receptors. PDGFRA and PDGFRB belong to the class III receptor tyrosine kinase (RTK) family. Although they share structural and functional features, they also have distinct biological roles. This combination of overlap and receptor-specific activity creates important considerations for the design of drug-screening tools.
Reqbio has developed several cell models for PDGFRA and PDGFRB. This article reviews the biological rationale for these targets and examines what the validation data demonstrate.
I. Biological Roles of PDGFRA and PDGFRB
A brief overview of their biology provides useful context.
The ligand-binding profiles of PDGFRA and PDGFRB differ, contributing to their distinct functional roles.
PDGFRA binds PDGF-AA, PDGF-BB, PDGF-AB, and PDGF-CC. It is primarily involved in mesenchymal cell development and tissue repair. Aberrant PDGFRA activation is closely associated with tumors including GIST and glioma. In particular, the D842V mutation in exon 18 is largely resistant to imatinib.
PDGFRB primarily binds PDGF-BB and PDGF-DD and is more closely involved in regulating pericyte and smooth muscle cell functions. It is strongly associated with fibrosis and cardiovascular disease and also contributes to GIST, although its role is generally less prominent than that of PDGFRA.
Following ligand binding, both receptors undergo dimerization and autophosphorylation, activating downstream pathways including RAS/MAPK, PI3K/Akt, and PLC-gamma signaling. In drug screening, the ability to distinguish which receptor is inhibited and to quantify the extent of inhibition depends on the performance and specificity of the assay system.
II. Drug Landscape Dominated by TKIs
Most approved drugs targeting PDGFRA or PDGFRB are small-molecule tyrosine kinase inhibitors (TKIs). Imatinib, sunitinib, and regorafenib are broad-spectrum inhibitors that also inhibit PDGFR signaling. Avapritinib is a highly selective type I TKI developed to target imatinib-resistant mutations such as PDGFRA D842V and was approved in 2020. Ripretinib uses a broad-spectrum switch-control mechanism and is used in later-line treatment of GIST.
This landscape indicates that drug development around these targets is relatively mature and highly competitive. It also creates substantial demand for quality control (QC) and potency testing. Reliable methods are needed to evaluate the inhibitory activity of each manufactured TKI batch against PDGFRA and PDGFRB.
Reqbio developed these cell models in part to support such applications.
III. PDGFRB Reporter Cell Data
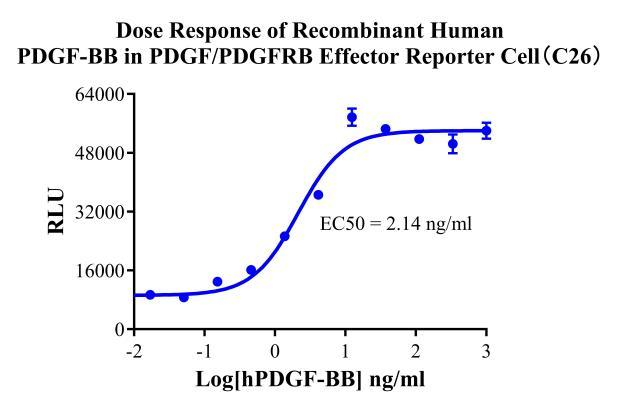
Figure 1. Dose response of recombinant human PDGF-BB in PDGF/PDGFRB effector reporter cells (clone C26).
Figure 1 shows the dose-response curve generated using PDGF/PDGFRB effector reporter cells.
The assay is based on activation of PDGFRB, which initiates downstream signaling and drives luciferase reporter expression. Recombinant human PDGF-BB, one of the principal ligands of PDGFRB, was added across a concentration gradient, and the resulting luminescent signal was measured.
The result is a typical sigmoidal dose-response curve. The signal remains low at lower ligand concentrations, increases progressively as the ligand concentration rises, and reaches a plateau at higher concentrations. The EC50 falls within the reported assay range, with a substantial assay window. These results show that the cell line produces a sensitive, quantitative response to PDGF-BB, providing a defined activation response for comparing the inhibitory activity of different TKI batches.
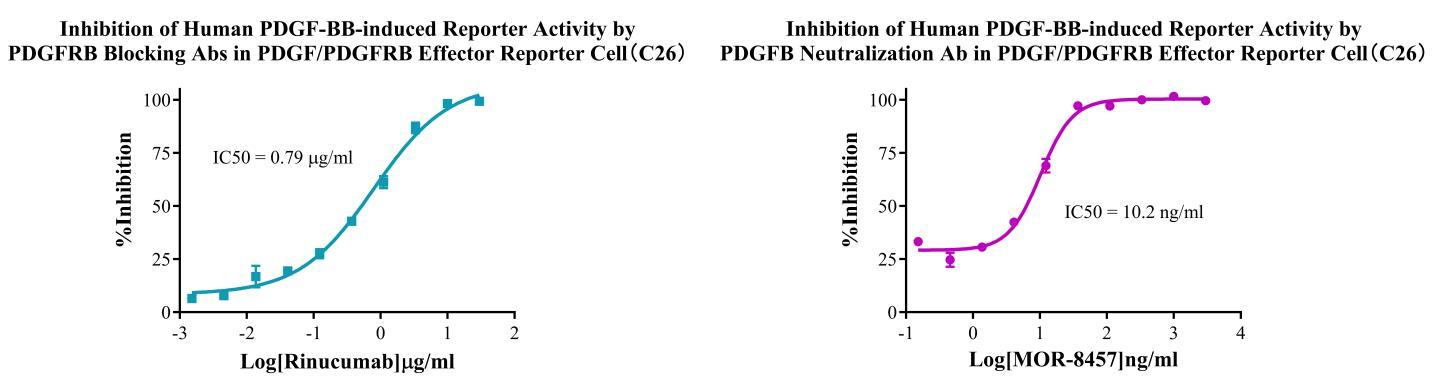
Figure 2. Inhibition of human PDGF-BB-induced reporter activity by a PDGFRB-blocking antibody and a PDGFB-neutralizing antibody in PDGF/PDGFRB effector reporter cells (clone C26).
Figure 2 presents two inhibition assays that evaluate different mechanisms of action.
The first curve shows the effect of a PDGFRB-blocking antibody. The PDGF-BB concentration was held constant while the anti-PDGFRB antibody was added across a concentration gradient. Reporter activity decreased progressively as the antibody concentration increased, demonstrating concentration-dependent inhibition.
The second curve shows the effect of a PDGFB-neutralizing antibody. In this assay, increasing concentrations of antibody neutralize the PDGF-BB ligand rather than blocking the receptor.
Both antibodies reduce reporter activity, but through distinct mechanisms: receptor blockade and ligand neutralization. This distinction is relevant when evaluating whether a candidate is a PDGFRB-blocking antibody or a PDGFB-neutralizing antibody. The model can be used to characterize the inhibitory response associated with each mechanism.
IV. PDGFRA Reporter Cell Data
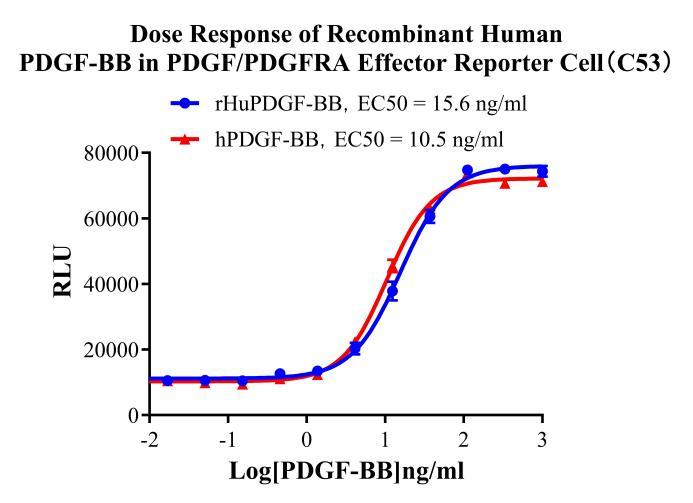
Figure 3. Dose response of recombinant human PDGF-BB in PDGF/PDGFRA effector reporter cells (clone C53).
Figure 3 follows an experimental design similar to Figure 1 but uses a PDGFRA reporter cell line, clone C53. Although PDGF-BB is a principal ligand of PDGFRB, it can also activate PDGFRA.
The PDGFRA reporter cells also generate a clear sigmoidal dose-response curve, with a consistent EC50 and a broad assay window.
The same PDGF-BB ligand generates distinct activation curves in the PDGFRB and PDGFRA reporter systems. These parallel systems provide a basis for evaluating receptor-subtype responses and may support subsequent assessments of compound selectivity between PDGFRA and PDGFRB.
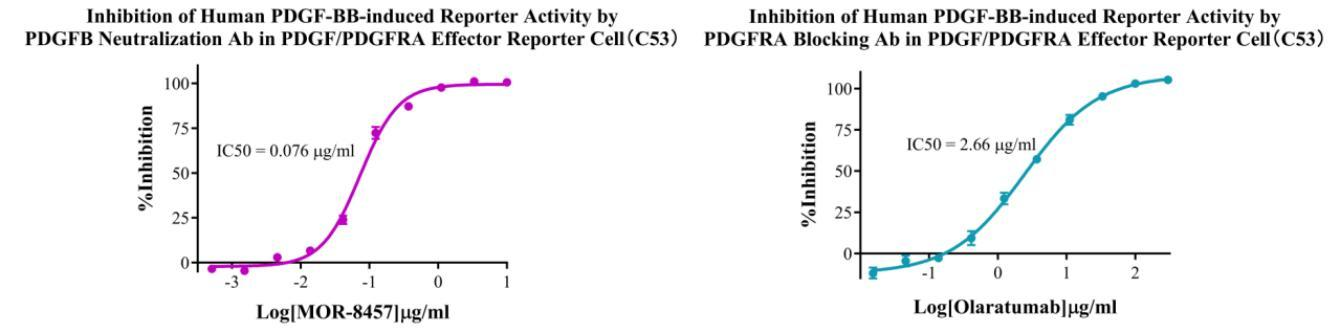
Figure 4. Inhibition of human PDGF-BB-induced reporter activity by a PDGFB-neutralizing antibody and a PDGFRA-blocking antibody in PDGF/PDGFRA effector reporter cells (clone C53).
Figure 4 presents two inhibition assays using the PDGFRA reporter system.
The first curve shows inhibition by a PDGFB-neutralizing antibody. Neutralization of the PDGF-BB ligand reduces PDGFRA-dependent reporter activity in a concentration-dependent manner.
The second curve shows inhibition by a PDGFRA-blocking antibody. Direct receptor blockade likewise reduces the reporter signal.
Together, these curves illustrate how the reporter cell system can evaluate compounds acting through two different mechanisms: ligand neutralization and receptor blockade.
V. Overexpression Cell Lines for Binding Related Applications
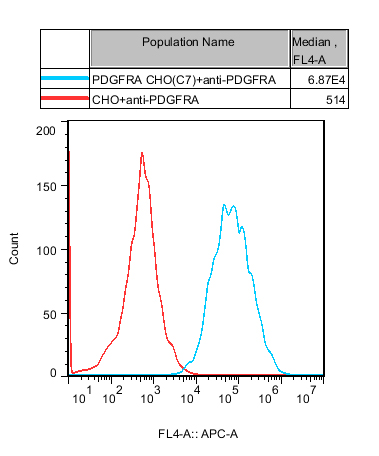
Figure 5. Recombinant CHO-k1 cells constitutively expressing PDGFRA.
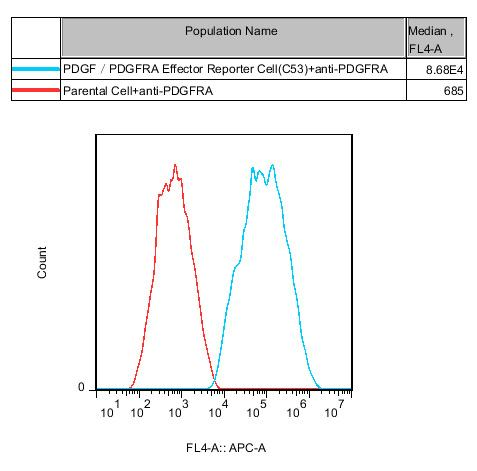
Figure 6. Recombinant HEK293 cells constitutively expressing PDGFRA.
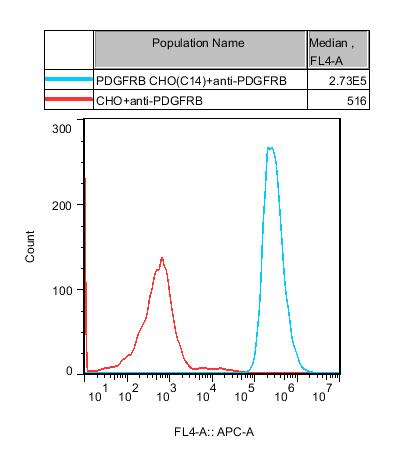
Figure 7. Recombinant CHO-K1 cells constitutively expressing PDGFRB.
Figures 5-7 show flow cytometry results for three overexpression cell lines: PDGFRA CHO, PDGFRA HEK293, and PDGFRB CHO. Each cell line shows a positive rate above 95% and stable target expression.
These overexpression cell lines serve applications different from those of the reporter cells. Reporter cells measure functional signaling, whereas overexpression cells support target-expression and binding-related studies. They may be used to assess antibody binding, evaluate target binding by an antibody-drug conjugate (ADC), or investigate target recognition by CAR-T cells.
PDGFRA models are provided in both CHO and HEK293 host backgrounds to support cross-validation. An antibody may display different binding signals in CHO and HEK293 cells. Using both host backgrounds can help assess potential host-cell-dependent effects.
VI. Applications of the Combined Cell Model Portfolio
The value of these models becomes clearer when they are used as a coordinated portfolio:
First, reporter cells address functional activity. Whether a candidate blocks the receptor or neutralizes the ligand, its inhibitory activity can be quantified in the system by determining the IC50. For TKI batch release, the model can serve as a standardized platform for activity testing.
Second, parallel PDGFRA and PDGFRB reporter systems address selectivity. Some TKIs, such as imatinib, have broad activity, whereas others are more selective, such as avapritinib with its preference for PDGFRA. Running a compound in both systems enables comparison of its activity against PDGFRA and PDGFRB and supports calculation of a selectivity index.
Third, overexpression cell lines address target expression and binding-related questions. CHO or HEK293 overexpression models can complement functional results by providing an additional system for evaluating target recognition and binding signals.
VII. Reliable Tools for Established PDGFR Targets
PDGFRA and PDGFRB have a long history as drug-development targets. Their established biology can reduce mechanistic uncertainty, but the competitive landscape creates a high technical bar. Reliable tools remain important for data quality and batch consistency. When cell-based activity testing is part of a TKI release strategy, a well-characterized cell model is essential for generating consistent QC data.
Reqbio developed this portfolio to provide coordinated tools for PDGFRA- and PDGFRB-focused drug development. The reporter cell models have been evaluated using ligands, receptor-blocking antibodies, and ligand-neutralizing antibodies to demonstrate the assay logic across these mechanisms.
If you are working on a PDGFRA- or PDGFRB-related program involving TKIs, antibodies, or other therapeutic modalities, contact Reqbio to learn more about the available cell models and supporting data.


news recommendation
CaSR: The Calcium Homeostasis Sentinel and a Core GPCR Target for Metabolic and Kidney Disease Research
CD3E: The T-Cell Activation Switch and Cell Models for Targeted Therapeutics
NFAT Signaling Pathway: A Critical Target for Drug R&D and Cell Models
TSHR Cell Model for Thyroid Cancer Drug Screening | GPCR Assay Platform-Reqbio
We Are Pleased to Announce: Global Commercial Licensing Rights for Jurkat E6.1, CHO-K1, HEK293, THP-1 and RAJI Cell Lines Officially Secured.
Explore